Saturday 17 November 2018

Project Solar - Good Priced Solar Panel Quote Or Rip off Prices?

Lots of people on the Moneysaving Expert forums are reporting quotes from a company called Project Solar that appear to be extortionate. The price of solar panels has come down massively since we got ours installed in 2011. The FIT rate has also dropped since then so it's not all positive news!

Project Solar Good Priced Quote?

Our panels cost £8999 for 14 panels rated at 3kWp but an equivalent now would be under £5000, suggestions are that you're now looking at approx £1000 per 1kWp of generation capacity so approx £3000. Forum members have reported paying £6000 for 5.1kWp of panels installed.

Project Solar appear to work in the same sort of way as doubling glazing companies of old - quote a high price and then drop it a bit to get business. The problem is that dropping a bit still isn't competitive and I'm always very wary of companies that are trying to rip you off with their original quotes.

In addition to the price one tactic that I've found several suppliers use is to suggest that inflation for electricity will be very high over the next 25 years because prices rose significantly over the last couple of years. In reality if prices rose by anything like the amount that some quotes are claiming then we'd be paying 75% of our wages on electricity by 2030!
Monday 12 November 2018

October 2018 Record breaking Solar Month

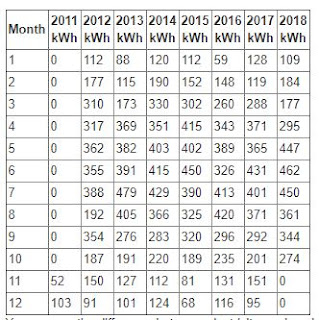
October 2018 has been another record breaking month for our solar panels with 274kWh generated, significantly higher than the previous best of 235 kWh back in 2016 and 73kWh more than last year.

It's actually been quite a year of extremes with March and April 2018 coming in well under previous years but May and June and October now being much higher.

Solar panel record generation 2018


http://solar-panels-review.321web.co.uk/index.php/yearly-comparison-of-solar-pv

Thursday 25 October 2018

2018 Solar Panel Data Updates

I've now added the data for our solar panels for the 9 months up to the end of September 2018. With the very long hot summer we've had some great months

http://solar-panels-review.321web.co.uk/index.php/yearly-comparison-of-solar-pv

May & June 2018 have had the best performance ever by quite a considerable margin. May 2018 was 447kWh when the previous best was 403kWh in 2014. All May solar data here

 June 2018 was 462kWh with previous best of 431 in 2017. The June data for our solar panels is here

Solar electricity generation summer 2018

Monday 3 September 2018

Solar Data to June 2018

I've now loaded the first six months of 2018 data to 30 June. Some interesting data that shows the "Beast from the East" cold weather event in March 2018 and how fantastically sunny June and May 2018 were with record solar generation during those months.

http://solar-panels-review.321web.co.uk/monthly-pv-solar-panel-generation.php

In the UK as a whole solar has made a much bigger contribution this year too.

Solar Data to June 2018

Tuesday 16 January 2018

2018-19 Feed in Tariff FIT Rate Level for UK Solar PV

The inflation rate for December 2017 has just been released today which means that the level of Feed in Tariff for 2018/2019 is now known.

The Feed in Tariff (FIT) rate for April onwards is based on RPI inflation rate for the previous December so the 2017 figure will determine the FIT tariff payment level from April 2018.

The FIT tariff level for 2017-2018 was 50.67p per kWh for generation and 3.57p per kWh for export which is deemed as 50% of the electricity generated.

The headline figure of CPI inflation for December 2017 was 3.0% but this isn't the number used to calculate the Feed in Tariff FIT level, the value needed is for RPI inflation which is much harder to find as it's no longer considered an "official" national statistic.

2018-19 Feed in Tariff FIT Rate Level for UK Solar PV
Solar PV generation meter - FIT rates 2018/19

Delving into the ONS statistics page it's eventually possible to locate the RPI number which is 4.1% for December 2017.


So to calculate the new FIT rate we need to multiply the old value of 50.67p by 4.1% which gives a new value of 52.75p for the Feed in Tariff rate as of April 2018-2019. The level for export will increase to 3.72p

https://www.ons.gov.uk/economy/inflationandpriceindices/datasets/consumerpriceinflation

Tuesday 9 January 2018

2017 Solar Panel Data UK

I've been a bit slow to update the data on my website over the past 12 months as it was becoming more tedious to do every month so I decided to batch it up. Unfortunately I subsequently discovered that the Sunny Boy inverter only holds 2 months of detailed daily data but full copies of the monthly summaries which means that a couple of months are lacking details.

http://solar-panels-review.321web.co.uk/index.php/yearly-comparison-of-solar-pv

With another year added to the totals it's interesting to see how the months may vary by year but often a bad month will be balanced out by a better month the same year so the overall totals are much closer that you might expect. For example 2015 and 2017 were only 6kWh different at 3207kWh and 3213kWh respectively. What does seem clear is that the maximum days are dropping which might be expected as the solar panels age so in 2017 we only had 1 day with over 20kWh of electricity produced.