Thursday 27 December 2012

Solar Panel Output - Shortest Day Behind Us!

With the shortest day now behind us we can start to look forward to improving solar panel outputs over the next few months. After the first year with our solar panels it was obvious how much lower the electricity output from solar panels is over the winter months.

Solar Panel Output - Shortest Day Behind Us!

While you may get a solid 16 hours generation during the summer months this can drop to around 6 hours or less during winter especially on very cloudy days. Last year on an extremely cloudy day we barely generated any electricity and on one snowy day had a 0 kWh output.

Luckily even with the poor summer of 2012 we still achieved over 20kWh of electricity generation on 4 days and over 15kWh on 55 days.

In contrast December had no days over 10kWh and only 8 days when above 5kWh was produced.

You can view the full yearly & monthly solar panel output statistics here

Tuesday 11 December 2012

Is Solar Panel Investment Still Worthwhile?

Are solar panels still worth buying as an investment or has the sun set on solar power?

We got our solar PV panels last year just before the FIT (Feed In Tariff) was cut from 45p to 21p. At the time it was a great investment and the speculation has been that the investment is no longer worth it. However in that time the price of solar panels has plummeted again so the investment may still be a good one.

I thought it would be useful to compare the numbers we obtained from our first years generation and run them through the calculations for a solar panels based on the new FIT rates and the current price for solar panels.

We paid £9000 for our 3kWp panels and get a FIT rate of 47p per kWh. These generated 3250kWh which produced an income of £1527

Latest panels look to be available for under £6000 for 4kWp panels and on a roof with the same direction as our 3kWp, should be expected to produce 4333kWh of electricity per year. The FIT income from this would be £693 at the 16p rate.

The payback period for our panels is just under 6 years, but the payback for a new installation at the lower FIT rate would still only be just over 8 years so in many ways still a very attractive investment.

When FIT was first introduced the price of solar panels was £16,000 or more for 4kWp so the price drop has meant that the lower FIT retains the same benefits as those at the time Feed in Tariffs were introduced.


Tuesday 4 December 2012

What is Annual UK Solar Panel Output from Domestic Installation?

What is the UK Solar Panel Output per year?


We have now had our solar panels for over 12 months so are starting to get year on year comparisons of the output.

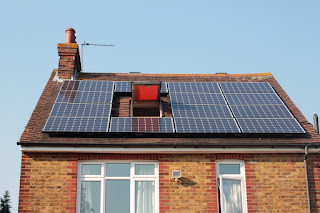
Our first year we generated 3095 kWh of electricity from our 3kWp panels (14x Sungrid 245W) but this would have been around 3250 kWh without a loss of 2 weeks generation in August 2012. This is substantially above the SAP2009 estimate of 2479kWh for a 3kWp system.

You can see this graph of Solar Panel Output in the UK which shows the peak at the middle of the day and how the output from solar panels drops towards the end of the day.

What is the UK Solar Panel Output per year?
What is the UK Solar Panel Output per day?

View UK Solar Panel Output details here


Tuesday 20 November 2012

One Year Later: Annual UK Solar Panel Output

After 12 months of of having our solar panels we have now reached that landmark of one year's solar generation. The annual output from our PV Solar Panels has surpassed even our wildest expectations and despite what was estimated to be the worst summer for 100 years we still generated 3095kWh of electricity over the year.

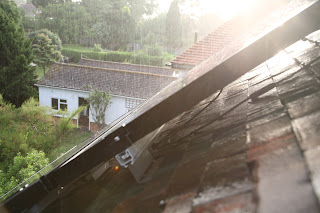
Rain falling on our solar panels
Rain on our solar panels was a common sight this year but even with the appalling summer weather we still generated 30% more than the SAP 2009estimates given with our quotes. The generation varied from 0kWh for a snowy day in February to 20.6kWh for the sunniest summer day. You can read more details here of solar panel UK output records

One Year Later: Annual UK Solar Panel Output
Without the inverter error in August I would expect our solar panels to have generated 3250kWh over the year which would equate to 1083kWh per kWP of solar panels. This is substantially above the normal estimates for the UK of around 800-900kWh of electricity per kWp of installed solar panel capacity.


Frosty solar panels in winter

Saturday 17 November 2012

Why Are Inverter and Generation Meter Readings different?

Why is the inverter reading not the same as the generation meter?


Something we noticed early on with our solar panels was that the inverter and generation meter readings differed. In our case the generation meter reads higher than the inverter but other people have found that the generation meter reading is lower than the inverter.

Over time this can be a significant difference. Approaching the first anniversary of our solar panels being commissioned our generation meter is reading 3079kWh and the inverter reads 3043kWh. The difference is approximately 1% higher reading for the generation meter.

Why is the inverter reading different to the generation meter?

The correct reading is the one on the generation meter as this meter is calibrated and manufactured to strict tolerances. The electricity reading from the inverter should only be considered an estimate and will vary from the true reading from the generation meter.

More solar panel FAQs here

Friday 16 November 2012

Connect to Sunny Boy Inverter via Bluetooth Using iPhone

Are you trying to connect to your SMA SunnyBoy via Bluetooth using an iPhone? Why does the Sunny Boy inverter not show using Bluetooth on an iPhone?


SMA SunnyBoy Bluetooth iPhone Connection
Unfortunately the Bluetooth on the iPhone does not allow it to connect to the Sunny Boy inverter. In fact the iPhone cannot even detect or display that the Sunny Boy inverter exists as the Bluetooth settings on the iOS software prevent this.

You can detect the SMA Sunny Boy inverter using an Android or Windows phone

Tuesday 13 November 2012

Total FIT Payment for Year - Final Payment Now Received

The cheque from British Gas has just arrived, 7 days after submitting the solar panel generation reading which means we have now had our 4 FIT (Feed In Tariff) payments since our solar PV panels were installed in November 2011. It hasn't quite been a year as the final reading was requested on 5th November but we have received FIT payments for 3025 units of electricity produced

Total FIT Payment for Year was £1401.62, this would have been higher apart from the disaster in August when the inverter stopped for 14 days, losing us around 150kWh of electricity generation.


Total FIT Payment for Year - Final Payment Now Received
Despite the exceptionally poor summer months we still have generated over 25% more electricity than the SAP2009 claimed figures which is a great result!

Sunday 4 November 2012

Solar PV Generation Landmark Reached!

We've been away for a few days and on return have checked our solar panels. While we were away our Solar PV panels have passed an electricity generation landmark and reached 3000kWh of electricity produced. Due to the inverter lockup in August which lost around 150kWh of electricity generation we should have passed this milestone last month but we have now produced 3007kWh of electricity in just over 11 months of operation.


Solar PV Generation Landmark Reached!
The SAP2009 estimated annual production came in at 2479kWh and the higher PV-GIS estimate was 2905kWh so we have comfortably beaten both estimates with nearly 3 weeks remaining and despite an appallingly wet summer that would have reduced electricity generated even further.

Wednesday 31 October 2012

Solar Panel Output in UK for October 2012

As it is now dark today the numbers are now complete for our solar panel generation for October 2012. After a very promising start with some excellent clear days the second half of October was appalling and dragged down the overall total so the month was just under the estimated value.

Our solar panels generated a total of 191 kWh in October, just below the 195kWh predicted by the SAP calculations. It does however mean that during October we passed the SAP estimate of 2905kWh for the year and still have 20 days of November to go.


You can see the breakdown of generation for October day by day on the PV Data grid here http://solar-panels-review.321web.co.uk/monthly-pv-solar-panel-generation.php It is interesting to see that the peak output is very consistent across the year but is only achieved for relatively few hours over the autumn/winter months compared to the summer.


PV Solar Panel Output October 2012
Solar Panel Output October 2012
We are almost approaching our first anniversary and I will amend the page to show a year by year comparison starting next month.

Tuesday 30 October 2012

How Much Electricity Do Solar Panels Produce Each Year in UK?

Before we got our solar panels I'd never really considered how much electricity solar panels would produce and certainly not to the level of detail of how the electrity generated would vary by day and by month. I'd not considered that the amount of electricity produced by the solar PV panels would increase from morning to midday and then drop towards dusk. This is typically referred to as a bell curve for the electricity produced.

The electricity produced by solar panels will vary depending on the following factors:

Amount of sunshine or cloud during the day
Daylight hours (depending on Month of year)
Temperature
Time of day (elevation of sun)
Shading
Direction

The mix of these factors will determine the amount of solar panel electricity generated at any point in the day and also the total for the month.

Our 3kWp solar panels (14x 235W) will have generated over 3000kWh of electricity over a full year but this ranges from 100kWh for a month in the winter to 400kWh for a month in the summer. The electricity generated during the day peaks when the sun is overhead and drops back towards the end of the day before falling to zero after dark.

How Much Electricity Do Solar Panels Produce Each Year in UK?
The electricity produced by solar panels in the UK in optimum conditions in the south of the UK is likely to be around 1000kWh per kWp of the panels. So an installation of 2kWp of solar panels would produced around 2000kWh of electricity in an ideal location. This would be lower if the panels were not facing south or were shaded and would decrease the further north they were located.

Friday 19 October 2012

Connect to SMA SunnyBoy Inverter via Bluetooth from iPhone

Are you trying to connect to your SMA SunnyBoy via Bluetooth using an iPhone? Why does the Sunny Boy inverter not show using Bluetooth on an iPhone?


SMA SunnyBoy Bluetooth iPhone Connection
Unfortunately the Bluetooth on the iPhone does not allow it to connect to the Sunny Boy inverter. In fact the iPhone cannot even detect or display that the Sunny Boy inverter exists as the Bluetooth settings on the iOS software prevent this.

You can detect the SMA Sunny Boy inverter using an Android or Windows phone

Monday 15 October 2012

Gas Meter Replacement from Imperial to Metric - Unit Conversion

Replacing Gas Meter from ft3 to m3

Although not directly related to our solar panels this may be of interest as it relates to energy use. We recently had our old Imperial gas meter reading in cubic feet replaced with a new Metric gas meter reading in m3 (cubic meters) by Southern Gas Networks. All well and good until we came to read the new Metric gas meter and got a complete shock!


Photo of Imperial gas meter reading in cubic feet cf /hcf hundreds of cubic feet
Imperial gas meter reading in cubic feet cf
The original imperial gas meter as shown in the photo above was reading in Cubic Feet. The new meter below is reading in cubic meters. Conversion from cubic meters to cubic feet is done by multiplying the cubic meter number by 35. So 1 cubic meter is 35 cubic feet.


Photo of Metric gas meter reading in cubic meters m3
Photo of Metric gas meter, reading in cubic meters

Using basic maths, three foot is approximately one meter so one cubic foot will be a lot less than one cubic meter. So again with basic maths you would assume that the new metric gas meter reading in cubic meters would increment a lot more slowly than an imperial gas meter and the reading would be a lot lower. Wrong!

After 24 hours we checked the new metric gas meter and found it was showing a reading of 5m3. At first glance something was seriously wrong - our usage hadn't changed yet the new meter was reading 5m3 when the old meter was reading around 10 cubic feet for a whole month! At this rate we would be looking at 150 cubic meters of gas for a month and a massive gas bill!

Something had to be wrong so I did some investigation on Google and rechecked the meter again.
The solution was actually very simple. Despite the old imperial meter reading in cubic feet the actual scale is hundreds of cubic feet - the decimal places are showing each cubic foot of gas not tenths of a cf. So every main digit that the imperial gas meter increments is actually 100 cubic feet of gas.

Over the course of a month with the imperial meter we were using 1000 cubic feet of gas which ties up nicely with the readings on the new meter.

The moral of the story is that if you have an imperial gas meter that is replaced with a metric one then remember that the old imperial meter reads in hundred cubic feet.


Friday 12 October 2012

Solar Panels Electricity Meter Going Backwards?

Solar panels electric meter going backwards on Sunny Days

Have you had Solar Panels installed and found that your electricity meter goes backwards when more electricity is being generated than used in your house?


Do you have an old style electricity meter with dials like this? If so it may well go backwards when your solar panels are producing more electricity than you are using. The meter below is a Landis & Gyr Elgee Single Phase Watt-Hour meter made in GB. Interestingly the new generation meter with our solar panels is also a Landis & Gyr one!


Solar Panels Installed and Electricity Meter Going Backwards?
If you are exporting electricity back to the gird your electric meter should not move. The electricity meter should not ever go backwards, however older analogue meters were never designed to have electricity generated at domestic properties and exported to the National Grid so can go backwards when you export with the dial rotating the wrong way.


Solar Panels Installed and Electricity Meter Going Backwards?
These meters will need to be replaced by the Electric supply company as they mean that you are effectively able to use the National Grid as a big battery storing your unused electricity and getting it back later.


As electricity is generated by solar panels at different amounts during the day and during the whole year your consumption doesn't always match the electricity being generated. Any surplus is exported to the grid at an assumed 50% of the electricity generated (unless you have an export meter fitted) regardless of how much you use on site.

When your electricity meter goes backwards you are being paid for the 50% deemed export but able to use 100% of the electricity as any not used at the time will reduce your meter reading and therefore be available again later.

Monday 8 October 2012

September Solar Panel Generation Performance

The data for September 2012 solar panel electricity generation is finally online after a delay due to losing the Bluetooth adapter for my laptop! Now I've found it again I've managed to download the data from the Sunny Boy inverter and added it to the site.

http://solar-panels-review.321web.co.uk/monthly-pv-solar-panel-generation.php

Adding data for September shows how the days are now shortening and the generation starting later and later each day.

However we are still on target to exceed 3000kWh for the year despite the loss of generation during August 2012.


September Solar Panel Generation Performance

Thursday 4 October 2012

Fantastic September Solar Panel Output

The output from our Solar Panels in September 2012 has been fantastic at 356kWh.

This has been better than March (314) & April (320 kWh) 2012 and virtually matching May (365) and June (360) 2012.

Apart from showing what a poor summer we had in the UK what makes these September solar panel generation figures even more remarkable is that the day length is substantially lower in September than it is in April, May & June meaning that the number of sunny days has to be even higher to match the June solar power generation outputs.

output from our Solar Panels in September 2012
 
Despite the August solar generation disaster with the inverter stopping during our holiday we are now on target to reach 3000kWh of solar panel electricity output for the year which is way above the SAP 2009 estimates of 2479kWh. The total would be higher if we hadn't lost 2 weeks of prime generation during August.


Tuesday 11 September 2012

Review of Solar Advanced Systems PV Solar Installation

Solar Advanced Systems Review


This is a time lapse video taken of our solar panel installation being fitted by Solar Advanced Systems of Edenbridge Kent. The solar panel array is 14 solar panels of 215W capacity giving a total potential output of 3kWp.


http://www.youtube.com/watch?v=m9ukxKHW6-c

The solar panels are now generating electricity and up to September 2012 had generated 2600kWh of electricity, well above the original SAP quoted figure for the whole year of 2479kWh and with 2 months still to go.

Review of Solar Advanced Systems solar panel installation.

As well as the quality of the installation and components an important consideration is the aftersales service. With the solar panels any downtime and loss of generation can end up costing you money as you are not generating and earning Feed in Tariff income. When we recently had a problem with our inverter giving an error Solar Advanced Systems were able to come out on the same day to investigate and resolve. Their staff have always been very helpful and happy to resolve any questions. We had some minor issues with paperwork prior to purchase but as that was during the storm that following the slashing of FIT payments in 2011 it was understandable with the chaos that ensued.


Review of Solar Advanced Systems solar panel installation.
Review of Solar Advanced Systems solar panel installation

Solar Advanced Systems Ltd - Unit 9 Edenbridge Trade Centre, Hever Road, Edenbridge, Kent, TN8 5EA

Tuesday 4 September 2012

Sunny Boy Solar Inverter Stops Working with Error 8

Just returned from holiday and found our inverter had stopped working! Nearly 2 weeks of prime August generation time had been lost, estimates based on other local installations indicates that this could equate to 180kWh of electricity generation that we have missed out on. With the FIT payments and electricity savings this is likely to equate to around £100 of lost income.

The most annoying part was that it appears the inverter developed the error on the day before we left so it could have been possible to resolve it before we went away and have not lost the generation for those days in August.

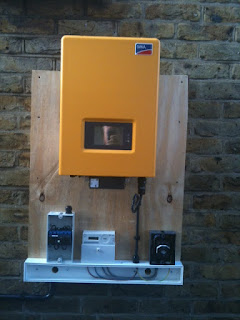
The error on the Sunny Boy 3000HF inverter was Error 8 - Waiting for Grid Voltage, Check Fuse,  Contact Installer. Having tried the usual turn off, turn on and resetting fuses without success we called out the installation company to investigate the problem.

Almost as frustrating as losing the generated electricity was that the solution was very simple - Turn off, leave off and turn back on again after 10 minutes. Obviously the short reset I had tried was not sufficient to restart or reinitialise the Sunny Boy inverter to reset the error. In addtion to the £100 of lost generation I was now down another £80 with the cost of the callout by the installers!


Sunny Boy 3000HF inverter was Error 8 - Waiting for Grid Voltage, Check Fuse,  Contact Installer
Sunny Boy 3000HF inverter was Error 8 - Waiting for Grid Voltage, Check Fuse, Contact Installer
So the moral of the story is - if your inverter stops and is giving an error I'd suggest turning off all switches, leave it overnight and turn on again to see if that resolves the problem before calling out the installers to investigate the problem.

Sunday 2 September 2012

British Gas Fast FIT Payments & Online Meter Reading

Just before we went on holiday I submitted the latest solar panel generation readings for our FIT payments using the NEW British Gas online form - yep it is now a form not email!

The benefit seems to be that processing of the FIT payment by British Gas is much faster despite previously being one of the fastest payers for FIT.

This time the reading was submitted on 14 August and the cheque for the Feed in Tariff payment (FIT) was issued on 18th August. The latest payment was for over £500 which is a nice chunk paying towards the installation.

Well done British Gas, all we need now is payment direct to the bank account by BACS rather than posting out cheques but with payments issued in 4 days I can live with that!


British Gas Fast FIT Payments & Online Meter Reading

Wednesday 22 August 2012

Solar energy savings ripoff shutdown

Manchester based Solar Energy Savings has been shutdown by the High Court after it failed to contest action brought against it alleging misleading sales information, high pressure sales tactics and vastly exaggerated solar panel outputs giving too low payback periods. The company has been subject to many complaints from online forum users about their claims especially the money back guarantees that appeared to be worthless.

Thursday 16 August 2012

Does Cooling Solar Panels Increase Electricity Output generated?

Last week we decided to do an experiment to see if cooling Solar Panels would increase the electricity output that they generated.

By feeding a hosepipe up to the roof on a sunny day we could use the velux window to direct the hose onto each panel in turn in order to cool them down.


Does Cooling Solar Panels Increase Electricity Output generated?
The results were dramatic. As soon as all the panels had been sprayed the electricity generated jumped by 300W from around 2.4kW to 2.7kW. This would tie in with the fact that heat decreases the electricity that solar panels generate by around 0.5% per degree of heating.

This weekend is forecast to be over 30C so it looks like the electricity output from the panels will not reach its maximum.

Sunday 12 August 2012

Sainsburys Now Biggest Solar Generator in Europe

Sainsburys, the UK supermarket chain has announced that it has now installed over 69,500 solar panels on 169 of its stores.

This will save 6,800 tonnes a year of carbon dioxide emissions and makes Sainsburys the top generator of solar power across Europe which is a pretty impressive feat when countries such as Germany had such a head start with their Feed in Tariff schemes.

Sainsburys 69,500 solar panels generate a total of 16MW suggesting that the panels used are 230Wp ones. On a domestic installation these would generate FIT payments of £7.2 million per year at the original rate. Obviously the Feed in Tariff only applies to domestic installations below 4kWp so Sainsburys would never get this money but it gives a comparison between commercial and domestic.


Sainsburys Now Biggest Solar Generator in Europe


Installing 69500 Solar Panels - Sainsburys Now Biggest Solar Generator in Europe

Wednesday 1 August 2012

July Solar Panel Power Data Loaded

The data for solar panel output for July has now been loaded to the website.

http://solar-panels-review.321web.co.uk/yearly-solar-panel-stats.php

Despite the poor weather July has not been too bad for electricity generation from our solar panels beating both the SAP and PV-GIS numbers.

The final electricity generated for July 2012 was 393kWh compared with a PV-GIS estimate of 351kWh.

In July there were 30 days with over 5kWh generation and 23 days over 10kWh but only the 1 day over 20kWh.

The depressing thought is that from now on it is all downhill as every month will get lower generation going into autumn and winter....

Monday 30 July 2012

July 2012 is Best Month So Far for Solar Panel Production

July 2012 has been our best month so far for electricity generated by our solar panels and we still have 1 day to go. As with June it really makes you wonder how incredible the electricity generated by solar panels would be if we had an amazingly sunny summer in the UK.

If we can beat the PV-GIS and SAP2009 figures with the summer we have had this year then a good summer could well be off the scale.

July 2012 is Best Month So Far for Solar Panel Production
So far July is giving a total generation of 384kWh compared to 351kWh prediction. The forecast for tomorrow isn't great so I'm not expecting the break the 400kWh barrier.

Thursday 26 July 2012

Effect of Shade on Solar Panels Output

What is the Effect of Shade on Solar Panels Output?


When installing solar panels it is important to choose a location that has minimum shading as electricity generated by solar panels drops when any one panel or part of a panel is shaded. Until today I'd not realised quite how much difference it makes.

Our solar panels are on our main roof which also has a velux window fitted. This is very convenient for checking the condition of the panels and for stopping pigeons nesting under them. It also has the potential for creating shade on the panels when the window is open!

What is the Effect of Shade on Solar Panels Output?
When checking the solar panel output logs in Sunny Explorer I noticed that there was a sharp drop in output from the panels despite it being a totally sunny day. On further investigation I realised that the velux window had been opened due to the heat and that as the sun dropped in the sky it was creating a shadow across the 2 panels.


Despite the shading only covering a tiny fraction of 2 panels over the course of about 90 mins at the end of the day we lost around 1kWh of solar electricity generation. Imagine how much could be lost by more significant shading over a longer period of time.

Saturday 14 July 2012

How do SAP Figures Compare to Actual Solar Panel Output?

When we were getting quotes for our solar panels all installers had to provide standard figures to show the estimated output of the panels. Some installers also provided much higher numbers to justify their installations as being superior.
How do SAP Figures Compare to Actual Solar Panel Output?
Now that we have had the solar panels for 8 months it is interesting to compare the actual output with the SAP 2009 figures that were provided at the time of installation.

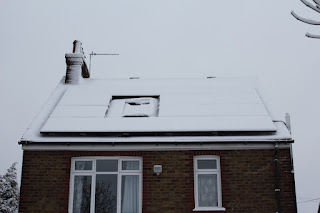
Snow on solar panels
How do SAP Figures Compare to Actual Solar Panel Output in winter?
Our solar panels are 14 Sungrid panels at 215W each giving a total potential output of 3010W (3.01kWp) The SAP 2009 annual yield was quoted at 2479kWh.

So far as of 13 July 2012 we have already generated 1972kWh of electricity in one of the worst British summers since records began with the wettest April and June since 1910. Extrapolating the generation figures over the next few months we could well see a total for the year of 3000kWh.

Solar panel generation - actual month by month output figures for the UK

Solar panel electricity output in the rain
Using PV GIS data to calculate the annual estimated output gives a figure of 2905kWh for the electricity produced by our solar panels for the year which again we should be able to beat even with the current amount of rain!

Comparison of predicted solar panel outputs for different estimation methods


SAP 2009                                 2479kWh
PV-GIS                                    2905kWh
Current Estimate on actual:     3000kWh

Sunday 8 July 2012

How Does Rain Affect Solar Panel Electricity Generation?

How Does Rain Affect Solar Panel Electricity Generation?


In what has become a depressingly familiar sight this year today has been another wet day. This summer has been quoted as the wettest since records began with April and June having more rain that any month since 1910. Fortunately not as wet as some parts of the country with a month's worth of rain falling in a few hours but sunshine and showers meaning yet again our solar panels have not been generating at their maximum that we would expect for the summer.

How Does Rain Affect Solar Panel Electricity Generation?
On a completely rainy summer day the electricity generated by solar panels can be less than 10% of the amount generated on a perfectly sunny day so for our panels we have sometimes got 2kWh for the day whereas a sunny day can be over 20kWh.

On a day like today though with mixed sunshine and showers the amount generated is not so bad and can equate to around 50% of the electricity you would generate on a sunny day, with around 10kWh generated today.

Peak electricity generation during mixed sun and rain

In fact on a rainy day with mixed sun and rain the peak generation can actually be far higher than the peak on a sunny day as the panels get cooled down by the rain so the immediately hit their maximum when the sun does come out. On a sunny day the peak output can be around 2.5kW but on a mixed day just after a rainy spell the peak can jump to as high as 3kW when the panels are cool.

This link explains how temperature affects the electricity output of solar panels

Sunday 1 July 2012

Problem with Imperial Gas Meter Shown as Metric on Bill So Undercharged

Since we moved into our house in 1999 we have had the same Imperial Gas Meter that reads in Cubic Feet.

Imperial Gas Meter Billed Metric Undercharged
Imperial Gas Meter Billed as Metric and Undercharged

We have been with the same supplier and always thought our bills were very reasonable but assumed it was because we were very careful to not overheat the house and time usage to match when we are home.

We always submitted readings to Scottish Power as requested and shortly afterwards received our bill. Nowhere on the bill or the gas meter readings section was any mention of the units that the consumption was measured in.

In 2010 we received a letter from Scottish Power that our meter had been recorded on their systems incorrectly as a metric meter when it was actually an imperial meter so we had been undercharged for our gas for 11 years. Scottish Power agreed to not backdate the charges but they amended their system so that the meter was now recorded correctly as an imperial meter.

How many people have been billed for Metric gas consumption and consequently undercharged? Equally if you are billed for imperial consumption with a metric meter you will be overpaying the gas company for your usage.

The factor involved appears to be 2.8x so if you are billed for imperial consumption with a metric meter you will be overpaying 2.8x more than you should

If you are billed for metric consumption with an imperial  meter you will be paying nearly 30% of the actual cost of the gas supplied.

Maybe the first thing the gas companies should be doing is showing the units on the bill and for any readings you supply - at least then you have a chance to check they match your meter.

June Solar Panel Generation Stats Now Loaded

The data from the Sunny Explorer application has now been loaded to the website

http://solar-panels-review.321web.co.uk/monthly-pv-solar-panel-generation.php

Despite being the wettest June since records began in 1910 the electricity generated was still on target which shows how huge the electricity generation would be if we had a massively sunny month. On the whole June was another poor month for solar power as it was very mixed weather as April and May had been.

Saturday 30 June 2012

How Important is Summer Solar Panel Electricity Generation?

When we first got our solar panels we hadn't realised how output varied over the year and the difference between the maximum output in summer and winter. The last few months have shown us how important summer months are for our solar panel output and how relatively insignificant the winter months are for the overall annual performance of your solar PV panels.

How Important is Summer Solar Panel Electricity Generation?
While December might have an average generation total of 100kWh, a good summer month can exceed this amount within 5 days. An exceptionally sunny summer month can generate such a massive excess over the average that winter generation is then irrelevant. The difference between 100kWh for an average December or a poor December with only 50kWh is so insignificant when a summer month can produce over 20kWh in a single day.

When we first installed the solar panels in November every day of sun was great to see the meter tick up but it is now obvious that those low amounts in winter are not important for the overall annual performance of your solar panels.


Wednesday 20 June 2012

Solar Panels Generation Longest Day -Maximum Output?

As today is the longest day I am hoping that our Solar Panels will generate the maximum electricity from them as it is also a rare sunny day in June unlike the rest of the month!

Our previous high was just over 20kWh in May 2012 so I am hoping that today we will break the 21kWh barrier which is around the maximum highest output we could expect from our 3kWp solar PV panels.

Maximum Solar power generation on longest summer day
Solar power generation on longest summer day

Sunday 17 June 2012

Solar Panel Feed in Tariff (FIT) Payment Delays

There are many posts on forums about the delays in payments for solar panels for the UK Feed In Tariffs and I know from speaking to a friend that they have yet to receive a payment for their panels installed 10 months ago.

The situation with British Gas (Centrica) has been very different in our experience. We have now received two FIT cheques from them for our solar panels installed 8 months ago (Nov 2011). The most recent payment has addressed some of the criticism that I'd felt with the first payment - namely that they cheque came without any supporting documentation or explanation of the calculations used.

The new British Gas Feed in Tariff advice note is very comprehensive and details the payments made under the Generation Tariff and Export tariff with a split covering the 31 March when the tariff rate changes.
British Gas FIT payments - solar panel payment summary
British Gas FIT payments - payment summary
Well done British Gas, an excellent service and very well designed remittance advice that is supplied.

To change or submit your FIT Feed in Tariff readings to British Gas look here

Sunday 3 June 2012

Another Month Beating Estimated Solar Generation

Amazingly we have now had another month that has beaten both the SAP2009 and PV-GIS solar generation estimates for our PV Solar Panels. May was predicted at 334kWh for SAP and 347 kWh for PV-GIS but the actual output generated by the panels was 365kWh (based on generation meter not inverter)

This now makes 5 out of the 6 months that have beaten or matched the PV-GIS targets and all six months since we installed the panels have significantly surpassed the SAP predictions.

The following page shows the output by month with the highest day solar panel output, the earliest start times and end times each month as well as the maximum peak output that the 3kWp panels produced.


Graph of Solar panel electricity generation during May 2012
Solar panel electricity generation during May 2012

You can see that for May 2012 the panels started generating electricity at 05:25 in the morning and stopped generating at 20:45 at night. The actual output at these times is insignificant at 12W but it shows how the generation day extends over the summer as the panels only start generating at 08:05 in January and finish at 16:30

Thursday 31 May 2012

How to Submit FiT Readings to British Gas to Get Feed In Payments?

How to Record British Gas FIT readings


When we had our Solar Panels installed we investigated the different options for registering our PV Panels under the MCS Scheme for the Feed In Tariff payments (FIT). We found there was no need to register your FITs with the electricity company that supply your energy. As our panels were installed very close to the December 2011 FIT payment being cut we wanted to make sure that our installation was registered in time so chose a FIT payment supplier that accepted applications online and also had a good record of paying FITs on time. There were many horror stories of EDF taking months to pay out but our experience with British Gas has been very positive so far.

How to Submit FiT Readings to British Gas to Get Feed In Payments?

We have recorded two FIT readings with British Gas now and are currently waiting for the second payment to arrive having submitted the readings recorded on 21 May.

To submit FIT readings to British Gas you need to send them as an email. The email must contain the following items:

Your Name
Your Address
Your Reading
The date of the reading

We use the British Gas reference number as the subject line of the email and the email is sent to  feedintariff@britishgas.co.uk 

More info on the British Gas FIT scheme here

http://www.britishgas.co.uk/products-and-services/solar-panels/solar-pv/feed-in-tariffs.html


How to Record British Gas FIT readings

Can I Use an iPhone to Communicate with My SMA Sunny Boy Inverter via Bluetooth?

When our solar panels were first installed I tried to connect to the SMA SunnyBoy inverter using my iPhone as it has Bluetooth already setup. The iPhone was unable to detect the SMA Inverter so initially I thought the Bluetooth was not configured on the SunnyBoy. However on further investigation it was possible to connect using a laptop so it appeared the problem was with the iPhone Bluetooth settings.

It seems like the iPhone Bluetooth configuration is very much restricted and that features that are standard on other Bluetooth devices are not possible on the iPhone hence the inability to communicate with the SMA inverter.

So the answer to the question "Can I Use an iPhone to Communicate with My SMA Sunny Boy Inverter via Bluetooth?" is unfortunately No.

Wednesday 30 May 2012

Why is The Peak Output of Solar Panels So Low? Why do my solar panels generate less than their rating?

When we got our Solar Panels I expected that they would generate electricity at a constant rate and that would be the same whenever the sun was shining. The reality is rather different. The output of your solar panels is affected by the length of the day, the temperature, the height of the sun in the sky and the cloud cover.

If you are finding your solar panels have a low Peak Output, much lower than the nominal kWp output that they are rated at then the most likely cause is temperature. PV Solar panels are less efficient the hotter they get and their rated output is measured at 25C. It is very noticeable that on a cloudy day the output can peak at very high levels, close to the maximum rating of the panels.

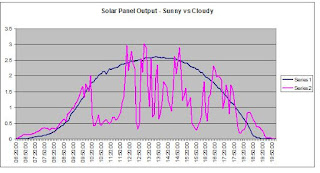
For some mixed sunny/cloudy days in April we got 3kW peak output from our 3kWp solar panels when the sun came out from behind a cloud. For consistently sunny days during May the daily peak has been far lower at around 2.3kW.


Why is Solar panel low peak output on hot days
Solar panel low peak output on hot days

You can see the difference in the graph above from April with the peak on the cloudy then sunny day reaching 3kW but the completely sunny day warmed the solar panels so the peak was lower at only 2.5kW. In May the peak electricity output was even lower due to the heat at 2.3kW.

Monday 28 May 2012

Effect of Temperature on PV Solar panel output in the UK

What is the effect of Temperature on PV Solar panel output in the UK?

How much variation does temperature cause for generating electricity from Solar PV Panels?

With one of the hottest days in the UK so far this year it is interesting to compare the output for a hot sunny day with a cooler sunny day earlier in the year.

The best generating day in April was 19kWh for a clear sunny day with temperature of 12C. Yesterday generated 17kWh for a clear sunny day with a temperature of 27C despite the longer generating time with the lengthening days.

Graph showing Effect of Temperature on PV Solar panel output
Solar panel output with different temperatures.
As you can see the output was for longer on the blue day (24 May) but the peak was lower than on the green day (2 April) as the temperature was far lower. The equation is the temperature coefficient which for our panels is 0.5% meaning output drops by 0.5% per degree over 25C. So for panels at 35C which is 10 degrees higher the output would be 5% lower.

As another comparison the maximum peak generation was around 2.3kW yesterday but for cooler days this has been as high as 2.5kW and for cloudy days with sunny spells it has peaked as high as 3kW showing the effect that temperature has on solar power generation.

One company was selling a hybrid solar panel that included water heating as well as electricity generation. As a method for cooling the solar panels to improve their efficiency it seems like an effective method based on this data as the water will extract the heat that can then be used for hot water in the house.

Solar panel generation in high temperatures

Friday 25 May 2012

Best Solar Output So Far - Today Breaks 20kWh Barrier

With a reasonable breeze today and slightly lower temperatures we have broken the 20kWh for the first time and got a new record for the electricity generated. By the time the sun set today we had generated 20.6kWh which is a full 1kWh more than the previous record set at the beginning of April. As per my blog post yesterday about the effect of temperature on solar panel electricity generation the cooler day as well as the breeze look to have contributed.

I think at 20kWh we are now getting very close to the maximum electricity that can be generated in the UK from 3kWp solar panels. I'm hoping we can hit the 21kWh target which would mean each 1kWp of panels had generated 7kWh which seems to be the maximum possible for us.

Maximum solar panel electricity output in UK

Thursday 24 May 2012

How does Temperature Affect Electricity Generated by Solar PV Panels?

How much variation does temperature cause for generating electricity from Solar PV Panels?

With one of the hottest days in the UK so far this year it is interesting to compare the output for a hot sunny day with a cooler sunny day earlier in the year.

The best generating day in April was 19kWh for a clear sunny day with temperature of 12C. Yesterday generated 17kWh for a clear sunny day with a temperature of 27C despite the longer generating time with the lengthening days.

Solar panel output with different temperatures.
As you can see the output was for longer on the blue day (24 May) but the peak was lower than on the green day (2 April) as the temperature was far lower. The equation is the temperature coefficient which for our panels is 0.5% meaning output drops by 0.5% per degree over 25C. So for panels at 35C which is 10 degrees higher the output would be 5% lower.

As another comparison the maximum peak generation was around 2.3kW yesterday but for cooler days this has been as high as 2.5kW and for cloudy days with sunny spells it has peaked as high as 3kW showing the effect that temperature has on solar power generation.

One company was selling a hybrid solar panel that included water heating as well as electricity generation. As a method for cooling the solar panels to improve their efficiency it seems like an effective method based on this data as the water will extract the heat that can then be used for hot water in the house.

Solar panel generation in high temperatures

Wednesday 16 May 2012

May Solar Generation Falls Short: Disappointing Solar Panel performance in May

We are now half way through the month and so far the electricity generated by our solar panels has been disappointing with the poor weather to blame. At the current rate May will be the first month when solar electricity generated has fallen well below target.
May solar panel performance lags behind target

Our record peak electricity generated remains the 1st April when you would actually expect the lengthening days to 22 June to break records consistently. The failure to reach new peaks shows the lack of clear sunny days and the number of rainy days since the hosepipe ban was introduced. Although the sun has shone at different times over the last 6 weeks we have not had a single day when the sun has been out all day with clear blue skies.

How does the Feed in Tariff (FITs) work?

The UK Feed in Tariff was modelled on one introduced in Germany and implemented in the UK from 2010. It pays households that have invested in solar PV power systems a set rate for every kilowatt hour of electricity that they generate as well as a payment for all electricity that they export to the national grid. The export payment is current calculated as "deemed" until smart meters are widely used across the UK. The deemed rate is assumed to be 50% of the electricity generated so if you can use a larger proportion at home then you will still be paid for it. As the export rate is much lower than the FiT rate this won't be a massive saving.
Feed in tariff details in the UK for your solar panels

Depending on your viewpoint the Feed in tariff has either been a huge success leading to large numbers of solar installations to help our CO2 reduction targets and massively cutting the price of solar power or an expensive scheme that has been abused by large players to make money at the expense of all consumers who effectively pay for FITs through a levy on electricity bills.

What is not in dispute is the drop in the costs of installation since 2010. It was common for a 4kWp solar pv system to cost up to £20,000 at the time and as of May 2012 this can cost as little as £7000 now. Putting the cuts in the feed in tariff in context these current prices still give a better return than the original rate with the higher prices.