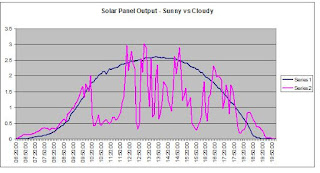
This now makes 5 out of the 6 months that have beaten or matched the PV-GIS targets and all six months since we installed the panels have significantly surpassed the SAP predictions.
The following page shows the output by month with the highest day solar panel output, the earliest start times and end times each month as well as the maximum peak output that the 3kWp panels produced.
 |
| Solar panel electricity generation during May 2012 |
You can see that for May 2012 the panels started generating electricity at 05:25 in the morning and stopped generating at 20:45 at night. The actual output at these times is insignificant at 12W but it shows how the generation day extends over the summer as the panels only start generating at 08:05 in January and finish at 16:30
No comments:
Post a Comment