Sunday, 1 December 2013

Dull November Means Poor Solar Electricity Generation

A dull November has meant a relatively poor month for Solar PV electricity generation. November 2013 only managed 128kWh of electricity generated compared to 152kWh for November 2012. One other aspect that may be affecting the generation at this time of year is shading of the solar panels.

You can view a month by month comparison of solar PV electricity output here

And a year by year comparison of solar output

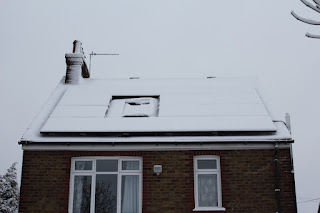
We have a tree in a neighbouring garden that shades the solar panels when the sun is low around the shortest day. From approx 2pm onwards the sun starts to be blocked from some panels which dramatically reduces the electricity generated. The tree may be higher that in previous years which would cause more blocking effect. You can see the impact of shading on the roof from the trees as below.

Dull November Means Poor Solar Electricity Generation

The long range forecast for December 2013 is for more sun and colder days which should improve the generation.

Sunday, 17 November 2013

Comparing Solar Output for Each Month Year by Year

Now that the data is building up from our solar panels with nearly 2 years worth of solar electricity generated from them it seemed useful to compare how each month varies year on year.

So the data can now be viewed month by month comparing each year against the next.

Comparing Solar Panel Output and Solar Electricity generated each month year by year

It is interesting to see how each month can vary so significantly and also how the different months of the year change. For example in January the start and end times are fairly constant but the overall output is significantly different.

January
MonthEarliest Start TimeLatest End TimeMax Peak Output kWTotal Monthly OutputTotal Generation Time (hours)Min Daily Generation kWhMax Daily Generation kWh
01/201308:0516:402.46087.891970.0239.35
01/201208:0516:302.388111.9132240.1939.51

Sunday, 27 October 2013

Do Solar Panels Generate during a Power Cut?

In the UK solar panels that qualify for FIT (Feed in Tariff) payments will not generate during a pwoer cut as they switch off immediately a grid failure is detected.

This is to protect any engineers working on the grid repairs so that electricity isn't being supplied into the system while they are working.

Solar Panels - What About Storm and Wind Damage?

With the predicted storm approaching the UK this weekend there may be people wondering about their solar panels being damaged by the wind and stormy conditions.


Solar Panels Storm Wind Damage

Solar panels are designed to withstand strong winds and are attached directly to roof beams if correctly fitted. The main problem that could be expected is damage to solar panels from flying debris or falling trees rather than the wind affecting them directly. And of course if we have power lines down and power cuts as a result then we won't get any electricity generation as the panels/inverter shut down when the grid is off.


Rain on Solar Panels - Can they be damaged by Storm Winds

Tuesday, 1 October 2013

Poor September for Solar as Sunshine Drops After Stunning July & August

September has been a disappointing month for the solar panels with a lowly 278kWh generated compared to 356kWh for September 2012.


Poor September for Solar as Sunshine Drops After Stunning July & August
July and August 2013 have been fantastic months for our solar panels with 484kWh and 411kWh generated respectively but with September now poor we are currently running at 86kWh less than 2012.

Weather for September hasn't actually been bad - it has been a fairly warm month and with very little rain in Kent but equally quite cloudy with few sunny days. You can see the details in the breakdown of monthly generated solar power.

You can also view the yearly solar panel electricity generation here

Thursday, 25 July 2013

July 2013 Beats Solar Panel Records for Electricity Generated

July 2013 has beaten all our previous records for electricity generated by our solar panels and the month isn't even over yet.

Up to 25th July with 6 more days to go, our solar panels have generated over 400kWh of electricity. This compares to a previous best for a full month of 395kWh.


July 2013 Beats Solar Panel Records for Electricity Generated

Although we would like plenty more sun for our solar panels it would be nice to have some rain to fill our water butts and IBC tanks. Let's see what the next 6 days can bring and how the final total for July 2013 will tally up.

Monday, 8 July 2013

Rainwater Harvesting using IBC Tanks and Water Butts

As well as our solar panels we have also developed a fairly extensive rainwater harvesting system that allows rainwater to be captured from various roofs and stored around the garden near to where it is needed.


Rainwater Harvesting using IBC Tanks and Water Butts
Although the setup allows us to save water as we are now on a water meter and to avoid the impact of hosepipe bans for gardening the primary reason for setting the rainwater harvesting system up was to have water available where it was needed so that watering cans could easily be filled instead of using hosepipes.

With 4 water butts holding 200 litres, 2 recycled juice barrels containing 200 litres and an IBC tank that contains 1000 litres of water we have a total rainwater storage capacity of 2200 litres. Despite this apparently large volume we can easily run out of rainwater after a few dry weeks.

IBC water storage tank

2012 was not a dry year so the tanks were at least half full for much of the summer but 2013 is proving to be much drier and with no significant rain for the last 8 weeks the tanks are currently virtually empty. We do have a submersible water pump that allows us to move water around the garden which can be powered using the electricity from our solar panels but with most of the tanks empty this is little use at present.

Monday, 1 July 2013

June 2013 Proves to be Best Ever Solar Panel Output Month

June 2013 has proved to be our best ever month for solar panel output. Our 14 Solar PV panels generated 395 kWh of electricity, just beating July 2012 which was 393 kWh. June 2013 also provided 4 of the best 10 days since our solar panels were fitted.

You can view all the stats here for June 2013 and every other month since November 2011.

http://solar-panels-review.321web.co.uk/yearly-solar-panel-stats.php

There is also now a page showing the best 10 days output for our solar panels since installation in 2011.


June 2013 Proves to be Best Ever Solar Panel Output Month

Saturday, 11 May 2013

Solar Thermal Water Heating Systems

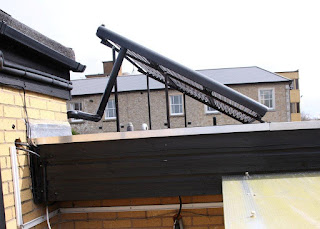
Although we have solar PV (Photo voltaic) panels that generate electricity there are also solar thermal systems that produce hot water directly from the sun heating darkened tubes that can then be stored in a normal hot water cylinder.

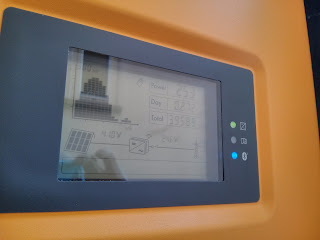
These are some photos that I was asked to take recently to show the setup of a commercial solar thermal hot water system.


Solar thermal tubes located on roof showing supports


Solar thermal tubes located on roof


Solar thermal panels temperature output reading


Solar thermal hot water cylinder

Solar thermal panels circulator

Tuesday, 7 May 2013

Solar PV Panel Feed In Tariff Cut Again

The Dept of Energy and Climate Change has announced that the FIT scheme will be cut by 3.5% from July 1st, one month earlier than originally planned.

The price of solar panels is still a long way below the prices charged when the Feed in Tariff scheme was introduced in 2010 with a 4kWp installation coming in at under £6000 from Solar Essence. This compares to a price of £16000 to £20,000 back in 2010. Our 3kWp system cost just under £9k in 2011 so prices have fallen substantially since then too.


Solar PV Panel Feed In Tariff Cut Again

Thursday, 2 May 2013

Why does Inverter Output differ from generation meter reading?

A common question about solar panels is why the reading that the generation meter shows is different to the reading shown by the solar inverter. The difference between the two readings can work either way, sometimes the inverter reads a higher generation figure, sometimes the generation meter can give the higher reading from the solar panels.

The reason is that the generation meter gives the correct number as it is calibrated and produced to a specific tolerance to meet the requirements of the MCS scheme in the UK and electricity companies. The value shown by the solar inverter is only an estimate and can be a few percent different to the solar generation meter.

As an example our generation meter yesterday passed the 4MWh milestone for generated solar electricity but our inverter is still only at 3952 kWh. The difference between the two readings is around 1.5% with the generation meter giving the higher reading.

Why does Inverter Output differ from generation meter reading?
Inverter reads 3958kWh


Why does Inverter Output differ from generation meter reading?
Generation meter reads 4006kWh

How does heat affect PV solar panels?

How does heat affect the output of PV Solar Panels?


In general PV solar panel efficiency is affected by increased temperatures so hot sunny days can actually generate less electricity which is the opposite to most people's expectations.


How does heat affect the output of PV Solar Panels?
Solar panels are tested at 25C and an efficiency factor worked out which is quoted as the "temperature coefficient of power in % per degree C". This shows the amount that the solar PV panels will reduce in efficiency for every degree that the panels are above 25C. Equally it will show the increase in efficiency when the solar panels are below 25C.

For our solar panels this temperature coefficient is -0.54 which means that for every degree over 25C the solar panels will generate 0.54% less electricity. If, for example, the temperature reached 35C then as this is 10C above 25C the efficiency would drop by 10 x 0.54 = 5.4%.

So on a cold sunny day at 25C you may achieve a maximum output from your solar PV array of 20kWh over the day, on a hot day at 35C you would only generate 20 x 95% = 19kWh of electricity.

The heat affect on solar panels has been very effectively shown during April 2013 when the weather has been relatively sunny but exceptionally cold for the time of year and the month has given two new records for daily output. The maximum electricity generated from our solar panels in 2012 was 20.3kWh yet this has already been exceeded on two days during April 2013.
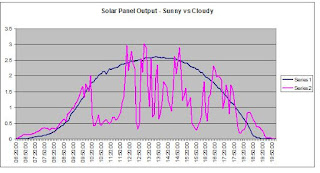

Graph showing effect of solar pv generation on hot day compared to cold day
Graph showing peak of solar pv generation on hot day compared to cold day

Wednesday, 1 May 2013

Solar Panels Generate 4 MWh of Electricity

With another good day of electricity generation from our solar panels we have now generated 4MW, that's 4000kW of electricity produced from the sun. Quite an impressive number in almost 18 months although it is only around 70% of what we use in a year.

In addition we have received the FIT amounts at 46p per kWh which is paying back the cost of the system.

Tuesday, 30 April 2013

April 2013 Beats Forecasts to be Best Solar Month Since July 2012

The sun has now set on April 2013 and the numbers show that it has been the second best month ever for our solar panels and the highest monthly amount of solar electricity generated since July 2012. Despite being 2 months away from the longest day April 2013 has also broken two records for the daily output from our panels.

April 2013 has also been the first month this year where the output from our solar panels has exceeded the electricity generated in 2012 and also beaten the SAP forecasts. January to March were way down on last year so it is a welcome sight to see April output bouncing back so well.

The full breakdown of April 2013 solar generation compared to 2012 is here.  It gives some interesting comparisons as April 2012 was a dull month when the weather switched from the sunny days of March to rain and cloud after the drought was announced! In April 2012 there were only 6 days above 15kWh generation but this had doubled to 12 days over 15kWh in April 2013.


April 2013 Best Month Since July 2012
April 2013 Beats Forecasts to be Best Solar Month Since July 2012

Despite what seemed to be a cloudy and cold month the PV solar panels generated a hefty 368 kWh in April 2013. In fact the cold weather actually helped improve the electricity generated by the solar panels as panel efficiency increases as the temperature drops which meant April 2013 also gave us a new daily record with over 21kWh of electricity produced.

Thursday, 25 April 2013

Solar Panel Price Increases - Further Rises Forecast

It has been reported that the price of solar panels sold in Europe has increased by 4% in March 2013, apparently the first increase seen since March 2009.

Over that time the price of a solar panel installation has dropped massively from around £18000 for 4kWp system to around £8000 now.


Solar Panel Price Increases


It is reported that prices are expected to rise by a similar 4% over the next few months so anyone considering installing solar panels may be advised to act sooner rather than wait.

http://press.ihs.com/press-release/design-supply-chain/european-solar-module-prices-rise-first-time-four-years

Submit British Gas FIT Readings Online for Feed In Tariff Solar Payments


We use British Gas for our FIT (Feed in Tariff) payments for our solar panels. This is a separate company to the one that supplies us with electricity and in some ways it helps to keep the two totally separate as you are likely to want to move supplier over the 25 year lifetime of the Feed in Tariff payment scheme.

Originally when we signed up to British gas our FIT Readings for the Feed In Tariff payments had to be sent by email to British Gas and soon afterwards a cheque was posted back to us with the FIT payments.

They have now improved this process so that British Gas Feed in Tariff solar electricity generation meter readings can be submitted online. You need your Meter Reading (obviously!) as well as your meter serial number and installation ID. Sensibly and very helpfully British Gas include this information on the email they send you to remind that a reading it due.

Once you have your generation meter reading you can submit your reading for FIT payments using the website below:

http://www.britishgas.co.uk/fitreads?cid=memgmrfit

The one improvement that is outstanding is to make payments by bank transfer but as British Gas seem to be one of the fastest FIT payers this is only a minor niggle!


Submit British Gas FIT Readings Online for Feed In Tariff Solar Payments

Saturday, 20 April 2013

Sunny Cold April Best Solar Panel Generation - Maximum Electricity Output from PV Solar Panels

One bonus of the cold weather we have experienced in the UK recently is that the cold improves the generation from solar panels by increasing their efficiency. Today has been a perfect example, a very sunny day but with below average temperatures of around 8C.

The net outcome has been the best ever electricity generation from our solar PV panels. Temperature does make a massive difference and a cold sunny day like today has generated more electricity than any day in 2012 which is pretty incredible when we are still 2 months away from the longest day.

Just imagine how much solar electricity you could generate from a very cold sunny day in June when the sun is above the horizon for so much more of the day.

The electricity generated today was 21.4kWh which is the first time our solar panels have breached the 21kWh level. In 2012 we had a few days that hit 20.5kWh but clearly the effect of temperature on the solar panel performance has outweighed the effect of the longer days in June and July.

The electricity generated per kWp of panels works out at over 7kWh per kWp which is quite an impressive performance and obviously is improved by our location and orientation of SSW facing solar panels.


Sunny Cold April Best Solar Panel Generation - Maximum Electricity Output from PV Solar Panels

Sunday, 14 April 2013

Solar Panels India - Rural Electricity Generation by Solar PV

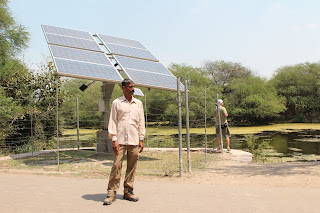
I recently returned from a trip to India travelling from Delhi to Agra and Pushkar then back to Delhi. Overall given the amount of sun in India I was surprised to see how few solar panels were installed. This was about the only set of Solar Panels we found in India that were in a nature reserve powering a school and other buildings.

Interestingly they were on a rotation mechanism so that they could turn to follow the direction of the sun giving better electricity generation. The downside of solar power generation in India is the temperature which reduces the efficiency of the solar panels. At least in the UK the lower temperatures compensate for the lesser amount of sun so


Solar Panels India - Rural Electricity Generation by Solar PV
 
Solar Panels India - Rural Electricity Generation by Solar PV
 

Tuesday, 9 April 2013

March 2013 Solar Panel Output - Cloudy days ruin Electricity Generation!

Having returned from holiday and found the weather to still be cold and damp it was no surprise to discover that the electricity from our solar panels in March 2013 was massively lower than in 2012.

The total generation shows the full horror!
 
March 2012 : 310 kWh
 
March 2013 : 173 kWh

Yes that is 137kWh less for the month than we obtained in 2012 which equates to over £60 in lost FIT income as a result. The SAP estimate was 210kWh and the PVGIS estimate 241kWh so this was a spectactually poor result compared to the estimates.

The total for the first 3 months of 2013 shows an equally bad picture with 376kWh compared to 599kWh in 2012 giving £100 less in FiT income.

You can see the full breakdown of 2013 Solar Panel electricity generation compared here


March 2013 Solar Panel Output - Cloudy days ruin Electricity Generation!

Thursday, 28 March 2013

Solar Output March 2013 Compared to 2012

After such a poor December, January and Feb, there were high hopes for March 2013 to be a far better month for the solar panels to generate some good amounts of electricity. Sadly these have been savagely dashed and March 2013 looks to be almost 50% down on March 2012.

Solar Output March 2013 Compared to 2012

While we have had one half of the weather that could give some very good solar panel outputs - the cold - we have been completely missing the critical part with a total lack of sun this month. As will be seen on some of the outputs at the end of the month a sunny day with temperatures of 2C will give much better electricity generation from Solar PV panels than a hot sunny day at 25C.

March 2012 was very sunny but also quite warm so sunny days this month with the freezing temperatures should give much better output. Sadly the number of sunny days has been severely lacking!

Friday, 22 March 2013

FIT Increase April 2013 - New Feed in Tariff Rates from April 2013?

What is the FIT Feed in Tariff Increase for April 2013?


The RPI figure for December has just been announced at 3.1% which means that the Feed in Tariff rates (FIT) will go up by this amount on 1st April 2013.

new rate Feed in Tariff rates (FIT) from 1st April 2013

Last year the rate increased from 43.3p to 45.4p per kWh of electricity generated and to 3.2p for exported electricity (deemed at 50%)

The new rate Feed in Tariff rates (FIT) from 1st April 2013 will be 46.8p and the export rate will be 3.3p.

2011 43.3p
2012 45.4p
2013 46.8p

With the 50% deemed export this means the main FIT rate is equivalent to 48.5p per kWh of solar PV electricity generated.

Saturday, 16 March 2013

Another terrible solar month

At the mid point of march the solar power generated is looking as poor as that for February and January and way below 2012. However on closer inspection the generation to date of 90kwh for march is identical to last year so fingers crossed that the remainder of the month matches last year and hits the 300kwh target.

Saturday, 2 March 2013

Terrible Solar Start to 2013: Comparison to Winter 2012

Our solar panels were installed mid way through November 2011 so we have now had 3 full months of year on year comparisons. With some really cloudy dull days they don't make very impressive reading!

Dec 2011 : 105
Dec 2012 : 92

Jan 2012 : 114
Jan 2013 : 89

Feb 2012 : 190
Feb 2013 : 118

Total for 3 months:

2012: 409 kWh
2013: 299 kWh

As can be seen on the month by month solar panel system stats the generation for Feb 2013 was badly hit by cloudy days with under 2kWh generation of solar power. In 2012 only 3 days generated less than 2kWh but in Feb 2013 this jumped to 12 days and in Feb 2012 there were 14 days with more than 10kWh generated but in 2013 this had dropped to only 9 days.

The combination of these meant that Feb 2013 was vastly lower for solar electricity generation than Feb 2012.

The only consolation is that these are the worst months of the year and a 25% lower generation won't make as much difference as a very poor summer.


solar power Comparison to Winter 2012

Thursday, 31 January 2013

Jan 2013 - Our Worst Month for Solar Panel Output

January 2013 has been our worst month ever for solar electricity generated by our Solar Panels. The total output for the month was 89kWh, way below Jan 2012 at 112kWh and even lower than the 92kWh for Dec 2012.

The month seemed to be continually cloudy either with snow which lost a couple of days to zero output or with rain which just reduced the generation down to under 1kWh for the day. The stats below don't tell the full story as the number of days below 5kWh was virtually identical between Jan 2012 and Jan 2013. Maybe days below 2kWh would show more of a difference.

http://solar-panels-review.321web.co.uk/yearly-solar-panel-stats.php

Fortunately from our experience last year poor output over the winter makes very little difference to annual solar panel generation. 25% lower in January isn't the end of the world - 25% lower in the summer would be a disaster and be equivalent to losing the whole of January's output!

Edit - just seen the stats released by the Met Office. The South East had only 72% of the long term average sun for the month of Jan 2013 which ties in with our solar generation being 25% below last year.


Jan 2013 - Our Worst Month for Solar Panel Output

Tuesday, 15 January 2013

What is the New 2013 FiT Rate (Feed In Tariff Rate) Solar Panels

The RPI figure for December has just been announced at 3.1% which means that the Feed in Tariff rates (FIT) will go up by this amount on 1st April 2013.

new rate Feed in Tariff rates (FIT) from 1st April 2013

Last year the rate increased from 43.3p to 45.4p per kWh of electricity generated and to 3.2p for exported electricity (deemed at 50%)

The new rate Feed in Tariff rates (FIT) from 1st April 2013 will be 46.8p and the export rate will be 3.3p.

2011   43.3p
2012   45.4p
2013   46.8p

With the 50% deemed export this means the main FIT rate is equivalent to 48.5p per kWh of solar PV electricity generated.

Tuesday, 1 January 2013

Solar Panel Electricity Generated in 2012 - South East UK Solar PV Output

After a very poor end to Dec 2012 the sun is shining brightly today so hopefully 2013 will be a better year for solar panel electricity generation than the very wet and cloudy 2012.

With the wet & cloudy end to the year December disappointed with a lower generation than Dec 2011 producing 92kWh compared to 105kWh last year. This is the first month that we have year on year comparisons as our panels were installed towards the end of November 2011.

Despite the wettest year in England since records began over 100 years ago the actual electricity generated by our solar panels was very respectable and well above the estimates at the time of purchase. It does make you wonder how  good a sunny year would be in comparison if we can achieve such good solar generation in wet & cloudy conditions.

The total electricity generated by our 3kWp solar panels in 2012 was 3068 kWh although this includes the inverter crash during August which reduced the total by around 150kWh so the annual total should have been over 3200kWh for 2012.

The estimated total of 3200 kWh for our 3kWp panels compares very favourably with another local installation of 3.3kWp that has generated 3254kWh for 2012.

You can view the full solar electricity generation by month and breakdown by various data sets on the link below.

http://solar-panels-review.321web.co.uk/yearly-solar-panel-stats.php


Solar Panel Electricity Generated 2012