Wednesday, 31 October 2012

Solar Panel Output in UK for October 2012

As it is now dark today the numbers are now complete for our solar panel generation for October 2012. After a very promising start with some excellent clear days the second half of October was appalling and dragged down the overall total so the month was just under the estimated value.

Our solar panels generated a total of 191 kWh in October, just below the 195kWh predicted by the SAP calculations. It does however mean that during October we passed the SAP estimate of 2905kWh for the year and still have 20 days of November to go.


You can see the breakdown of generation for October day by day on the PV Data grid here http://solar-panels-review.321web.co.uk/monthly-pv-solar-panel-generation.php It is interesting to see that the peak output is very consistent across the year but is only achieved for relatively few hours over the autumn/winter months compared to the summer.


PV Solar Panel Output October 2012
Solar Panel Output October 2012
We are almost approaching our first anniversary and I will amend the page to show a year by year comparison starting next month.

Tuesday, 30 October 2012

How Much Electricity Do Solar Panels Produce Each Year in UK?

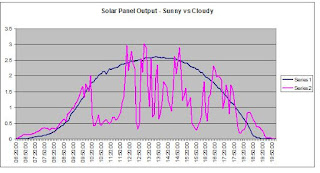
Before we got our solar panels I'd never really considered how much electricity solar panels would produce and certainly not to the level of detail of how the electrity generated would vary by day and by month. I'd not considered that the amount of electricity produced by the solar PV panels would increase from morning to midday and then drop towards dusk. This is typically referred to as a bell curve for the electricity produced.

The electricity produced by solar panels will vary depending on the following factors:

Amount of sunshine or cloud during the day
Daylight hours (depending on Month of year)
Temperature
Time of day (elevation of sun)
Shading
Direction

The mix of these factors will determine the amount of solar panel electricity generated at any point in the day and also the total for the month.

Our 3kWp solar panels (14x 235W) will have generated over 3000kWh of electricity over a full year but this ranges from 100kWh for a month in the winter to 400kWh for a month in the summer. The electricity generated during the day peaks when the sun is overhead and drops back towards the end of the day before falling to zero after dark.

How Much Electricity Do Solar Panels Produce Each Year in UK?
The electricity produced by solar panels in the UK in optimum conditions in the south of the UK is likely to be around 1000kWh per kWp of the panels. So an installation of 2kWp of solar panels would produced around 2000kWh of electricity in an ideal location. This would be lower if the panels were not facing south or were shaded and would decrease the further north they were located.

Friday, 19 October 2012

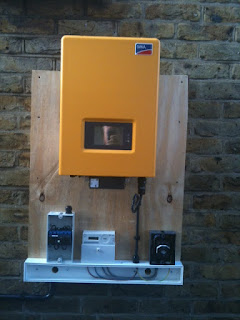
Connect to SMA SunnyBoy Inverter via Bluetooth from iPhone

Are you trying to connect to your SMA SunnyBoy via Bluetooth using an iPhone? Why does the Sunny Boy inverter not show using Bluetooth on an iPhone?


SMA SunnyBoy Bluetooth iPhone Connection
Unfortunately the Bluetooth on the iPhone does not allow it to connect to the Sunny Boy inverter. In fact the iPhone cannot even detect or display that the Sunny Boy inverter exists as the Bluetooth settings on the iOS software prevent this.

You can detect the SMA Sunny Boy inverter using an Android or Windows phone

Monday, 15 October 2012

Gas Meter Replacement from Imperial to Metric - Unit Conversion

Replacing Gas Meter from ft3 to m3

Although not directly related to our solar panels this may be of interest as it relates to energy use. We recently had our old Imperial gas meter reading in cubic feet replaced with a new Metric gas meter reading in m3 (cubic meters) by Southern Gas Networks. All well and good until we came to read the new Metric gas meter and got a complete shock!


Photo of Imperial gas meter reading in cubic feet cf /hcf hundreds of cubic feet
Imperial gas meter reading in cubic feet cf
The original imperial gas meter as shown in the photo above was reading in Cubic Feet. The new meter below is reading in cubic meters. Conversion from cubic meters to cubic feet is done by multiplying the cubic meter number by 35. So 1 cubic meter is 35 cubic feet.


Photo of Metric gas meter reading in cubic meters m3
Photo of Metric gas meter, reading in cubic meters

Using basic maths, three foot is approximately one meter so one cubic foot will be a lot less than one cubic meter. So again with basic maths you would assume that the new metric gas meter reading in cubic meters would increment a lot more slowly than an imperial gas meter and the reading would be a lot lower. Wrong!

After 24 hours we checked the new metric gas meter and found it was showing a reading of 5m3. At first glance something was seriously wrong - our usage hadn't changed yet the new meter was reading 5m3 when the old meter was reading around 10 cubic feet for a whole month! At this rate we would be looking at 150 cubic meters of gas for a month and a massive gas bill!

Something had to be wrong so I did some investigation on Google and rechecked the meter again.
The solution was actually very simple. Despite the old imperial meter reading in cubic feet the actual scale is hundreds of cubic feet - the decimal places are showing each cubic foot of gas not tenths of a cf. So every main digit that the imperial gas meter increments is actually 100 cubic feet of gas.

Over the course of a month with the imperial meter we were using 1000 cubic feet of gas which ties up nicely with the readings on the new meter.

The moral of the story is that if you have an imperial gas meter that is replaced with a metric one then remember that the old imperial meter reads in hundred cubic feet.


Friday, 12 October 2012

Solar Panels Electricity Meter Going Backwards?

Solar panels electric meter going backwards on Sunny Days

Have you had Solar Panels installed and found that your electricity meter goes backwards when more electricity is being generated than used in your house?


Do you have an old style electricity meter with dials like this? If so it may well go backwards when your solar panels are producing more electricity than you are using. The meter below is a Landis & Gyr Elgee Single Phase Watt-Hour meter made in GB. Interestingly the new generation meter with our solar panels is also a Landis & Gyr one!


Solar Panels Installed and Electricity Meter Going Backwards?
If you are exporting electricity back to the gird your electric meter should not move. The electricity meter should not ever go backwards, however older analogue meters were never designed to have electricity generated at domestic properties and exported to the National Grid so can go backwards when you export with the dial rotating the wrong way.


Solar Panels Installed and Electricity Meter Going Backwards?
These meters will need to be replaced by the Electric supply company as they mean that you are effectively able to use the National Grid as a big battery storing your unused electricity and getting it back later.


As electricity is generated by solar panels at different amounts during the day and during the whole year your consumption doesn't always match the electricity being generated. Any surplus is exported to the grid at an assumed 50% of the electricity generated (unless you have an export meter fitted) regardless of how much you use on site.

When your electricity meter goes backwards you are being paid for the 50% deemed export but able to use 100% of the electricity as any not used at the time will reduce your meter reading and therefore be available again later.

Monday, 8 October 2012

September Solar Panel Generation Performance

The data for September 2012 solar panel electricity generation is finally online after a delay due to losing the Bluetooth adapter for my laptop! Now I've found it again I've managed to download the data from the Sunny Boy inverter and added it to the site.

http://solar-panels-review.321web.co.uk/monthly-pv-solar-panel-generation.php

Adding data for September shows how the days are now shortening and the generation starting later and later each day.

However we are still on target to exceed 3000kWh for the year despite the loss of generation during August 2012.


September Solar Panel Generation Performance

Thursday, 4 October 2012

Fantastic September Solar Panel Output

The output from our Solar Panels in September 2012 has been fantastic at 356kWh.

This has been better than March (314) & April (320 kWh) 2012 and virtually matching May (365) and June (360) 2012.

Apart from showing what a poor summer we had in the UK what makes these September solar panel generation figures even more remarkable is that the day length is substantially lower in September than it is in April, May & June meaning that the number of sunny days has to be even higher to match the June solar power generation outputs.

output from our Solar Panels in September 2012
 
Despite the August solar generation disaster with the inverter stopping during our holiday we are now on target to reach 3000kWh of solar panel electricity output for the year which is way above the SAP 2009 estimates of 2479kWh. The total would be higher if we hadn't lost 2 weeks of prime generation during August.