Friday 19 November 2021

10 Years of Solar Panels - How Much Electricity Generated & Money Made?

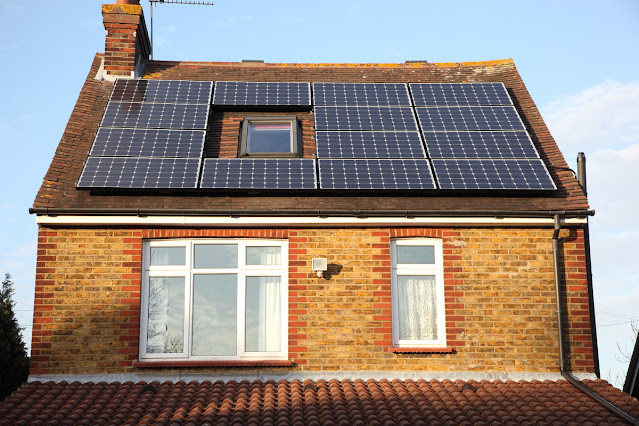
 It's exactly 10 years since our solar panels were commissioned on 19th November 2011

We've now generated 32528 kWh of electricity in that time so an average of 3250 kWh per year.

Our panels paid for themselves in 5 years and we still have another 15 years of Feed in Tariff payments to come, all of which are index linked. The current payment is 58p per kWh generated which looks like it might increase by 6% in April 2022.

The total FIT payments received so far is £16869.12 which includes the export payments as well. We have also had electricity costing approximately £4500 to use as well. The system cost £9000 so taking into account the electricity that we've saved it's been a very good investment.

Have you got a solar PV system installed? How do you find your generation in comparison? Is our production exceptional or similar? Please give your feedback in the comments below
10 Years of Solar Panels - How Much Electricity Generated & Money Made?


Wednesday 17 November 2021

Good Inflation News for Solar! RPI Jumps in October

 The news today is all about the high levels of inflation in the UK, the core CPI rate has risen to 4.2% for October 2021 as a result of price increases for used cars, gas/electricity and petrol amongst other things. It might be bad news for consumers but if you have solar panels with the Feed in Tariff it could be good news as your FIT rate will increase by a higher amount.

The CPI rate isn't the one used for calculating the FIT prices, it's actually determined using the RPI (Retail Prices Index) which is no longer consider an official statistic any more so is a bit harder to find. However if you search the ONS website you'll see that RPI for October was a staggering  6%.

If this stays the same it means that the FIT rate will increase from 56.03p per kWh to 59.39p per kWh in April. 

If RPI increases further as is expected then we may breach the 60p FIT level. That'll help to offset the massive rise in gas and electricity prices we're paying!

Good Inflation News for Solar! RPI Jumps in October


Wednesday 11 August 2021

2021 Solar Output Drops Compared to 2020

 The exceptional summer of 2020 hasn't been replicated in 2021 and the solar electricity generation from our panels has dropped substantially. I guess this is to be expected as it then averages out the numbers back standard.

It's quite noticeable how much lower output the 2021 months are compared to 2021 for our solar panels in Kent UK.

http://solar-panels-review.321web.co.uk/index.php/yearly-comparison-of-solar-pv

March 2020

334 kWh

March 2021

260 kWh

May 2020

517 kWh

May 2021

383 kWh

Jump forward to July and 2021 and 2020 are virtually identical at 394 vs 390 kWh.

May 2020 at 517 kWh was the highest monthly generation that we've had from our solar panels over the 10 years that we've had them installed.

2021 Solar Output Drops Compared to 2020


Tuesday 15 June 2021

Best Months of Year for Solar Panels UK - Not Expected!

We've had our solar panels for over years now so we've collected a lot of data showing the generation over the days and months since 2011. Some interesting patterns have emerged that aren't necessarily what you would expect.

There are the more obvious extreme generation examples where you get very high and very low months depending on the weather but the month that is routinely lower than you would imagine is June.

Over the 10 year average data June is consistently lower than either May or July which is really odd as you would expect June to be the highest month for solar electricity generation as it has the longest days. Both May & July should be lower because the daylight hours are either lengthening or shrinking compared to June.

May total - 4064kWh - average 406kWh

June total - 3943 kWh - average 394 kWh

July total - 4155 kWh - average 415 kWh

So as you can see June is on average lower than May or July. This isn't just a quirk from a particularly bad June or good May or July but seems to be a genuine trend. Out of the 10 years, 5 of them have June lower than May & July and in only 3 years is June higher than both May and July.


Tuesday 20 April 2021

British Gas FIT Payment Installation ID Problems

 I've had my solar panels for 10 years this year and over that time registered the generation meter readings every 3 months or so to get the FIT (Feed in Tariff) payments from British Gas.

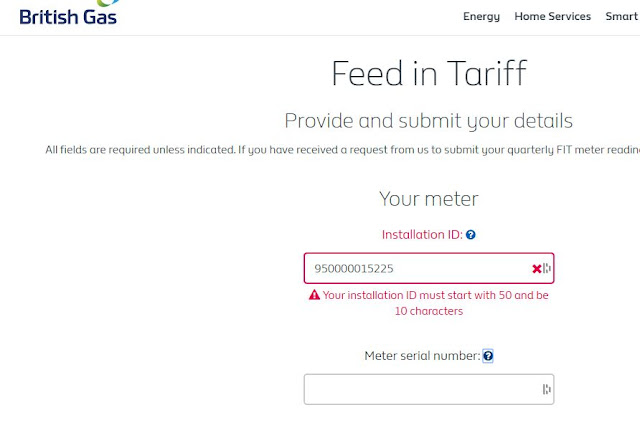
I've come to do the same today and the British Gas website is refusing to accept the installation ID for my system. The number I have had since the system was fitted starts 95000 and is 12 digits long yet the BG FIT payment screen insists that the ID must begin with a 5 and be 10 digits long.


It would appear that British Gas have made some amendments to their FIT payment screens but not actually checked whether they work.

Update - on checking elsewhere it appears that BG have generated new Installation IDs but failed to actually inform any of the solar owners what the new numbers are or even to put a message on their website to let people know that it has changed.


Quite incredibly the help icon next to the error that states the installation ID must be 10 characters actually shows a 12 digit number next to it!

Very poor show British Gas! Maybe it's a deliberate ploy to stop people claiming their FIT payments!