Friday, 8 November 2024

Samsung RS21 DGRS American Fridge Freezer Energy Power Consumption

I've recently been given a Samsung RS21 DGRS American style double fridge freezer and before switching over to it I wanted to find out what the energy/power consumption was. Having installed solar panels and made lots of energy efficiency savings at home I didn't want to suddenly undo all that work by adding an energy guzzling fridge freezer. However it was proving very difficult to find any information that gave definitive values for a energy/power use for the Samsung Fridge freezer and the Samsung website with specification details was particularly lacking information.

Samsung RS21 DG-RS  American Fridge Freezer Energy Power Consumption
Samsung RS21 DGRS  American Double Fridge Freezer Energy/Power Consumption 

Thanks to this lack of energy consumption info I decided to connect my Tapo energy monitor to the plug before getting rid of our old fridge freezer so I could check exactly what electricity the Samsung RG21 was actually consuming in real use.

As you can see from the graphs below it is consistently averaging between 1.6kWh and 1.9kWh per day which actually compares quite favourably to our old fridge freezer which was between 1.2kWh and 1.6kWh per day.

The Samsung RG21 DG-RS has independent temperature controls for the fridge and freezer. For reference I've set the fridge to 4C and the freezer to -18C which seemed to be the optimum values for us.

The graph below shows the energy consumption per day for the Samsung RG21 DGRS fridge freezer - ignore the first and last days as they were only partially covered.

The graph below shows the energy consumption per day for the Samsung RG21 DGRS fridge freezer
The graph shows the energy consumption per day for the Samsung RG21 DGRS fridge freezer

The graph below shows the Samsung RG21 power use and energy consumption over a 24 hour period. As you can see there are regular peaks and troughs with it switching between running around 140W and then dropping to zero as the compressor switches off. This gives the average for the day of around 1.6-1.8kWh of energy use.


The graph below shows the Samsung RG21 power use and energy consumption over a 24 hour period
Samsung RG21 power use and energy consumption over a 24 hour period

Samsung RG21 power use and energy consumption
Samsung RG21 DGRS Temperature Controls

Wednesday, 17 January 2024

New Solar Feed in Tariff FIT Rates for April 2024 Onwards

UK Feed in Tariff rates (FIT) are based on the RPI inflation rate for December which is released in January. 

The RPI rate for December 2023 has just been released at 5.2% so by my calculations it gives a new FIT rate as below:

Generation rate was 68.3p so now 71.85p per kWh generated

Export rate was 4.82p so now 5.07p per kWh exported

One of the only benefits of high inflation has been the increase in FIT payments over the last few years!

New Solar Feed in Tariff FIT Rates for April 2024 Onwards


Tuesday, 28 March 2023

SMA Sunny Boy Inverter Dead - Replacement Needed!

 I realised this week that my Sunny Boy inverter had stopped working, rather remiss of me that it took a few days before I found out but at least I know now.

SMA Sunny Boy Inverter Dead - Replacement Needed!

I've tried a few reboots and it looks like it is something that isn't fixable so new inverter is on order. With the better weather (hopefully) coming I can't really afford to have the system off for any significant length of time as every lost kWh costs me 72p now and with 20kWh days that starts to mount up.

One benefit is the onwards move in technology in the 12 years since our system was installed so the new inverter will have much better data capability than the Sunny Boy which used quite clunky Sunny Explorer software and had to be connected via Bluetooth to access it.

Wednesday, 18 January 2023

New FIT Rate Feed In Tariff April 2023

 The Feed in Tariff for April 2023 onwards is based on the RPI figure for December 2022 which was announced today as 13.4%. This means that the FIT rate for early adopters pre-2012 is increasing from 60.23p per kWh generated solar power to 68.30p per kWh. This is about the only advantage of high inflation rates!

Sunday, 3 April 2022

Solar Panel 10 Year Review - Green Electricity Generation

Having now had our solar panels for over 10 years it seemed an appropriate time to do a review of how they've performed in that time. We've had over 32,000 kWh of electricity generated as well as all the Feed in Tariff income.

You can see the video here

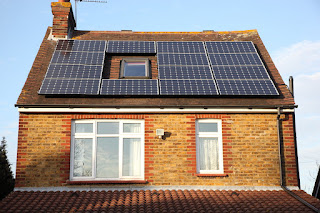
Our panels on top roof


Solar Panel 10 Year Review - Green Electricity Generation

The shading from trees in early afternoon in winter

Sunday, 13 February 2022

Worst Ever December Best January!

 The worst ever December generation for Dec 2021 has been followed by our best ever January which shows how the solar electricity generated can even out over the year with very poor months compensated by much better months afterwards. 2021 was still overall our worst month for solar but not as bad as it could have been. December along was around 50% of the average we've generated over the last 10 years and that was despite no snow - or possibly because we had no snow. The month was cloudy, wet and dull for most of the days so it made a very low out output month.


The highest day of generation was just over 7kWh which was also our lowest maximum for a December day in the last 10 years.

Luckily January more than compensated with 136kWh of power generated, some 30% above the average for the month.

http://solar-panels-review.321web.co.uk/index.php/solar-power-month-by-month/12-monthly-data/14-monthly-uk-solar-panel-electricity-output-for-january


Wednesday, 19 January 2022

FIT Rate April 2022 Solar Feed in Tariff Payments

 The RPI rate for December 2021 has been announced today as 7.5% so this is the amount that Feed In Tariff rates will increase from April 2022.


The current generation rate for pre 2012 installations of 56.03p will increase to 60.23p and the export rate of 3.95p will increase to 4.25p.

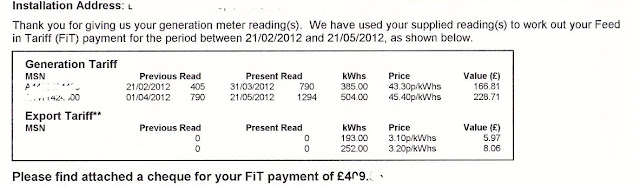
My latest FIT payment of £227 would have increased to £244 so it's a nice increase at a time when other fuel prices are going through the roof.

FIT Rate April 2022 Solar Feed in Tariff Payments

You can see in the table above how much the rates have increased since 2012 when the generation rate was only 45.4p. 


Friday, 19 November 2021

10 Years of Solar Panels - How Much Electricity Generated & Money Made?

 It's exactly 10 years since our solar panels were commissioned on 19th November 2011

We've now generated 32528 kWh of electricity in that time so an average of 3250 kWh per year.

Our panels paid for themselves in 5 years and we still have another 15 years of Feed in Tariff payments to come, all of which are index linked. The current payment is 58p per kWh generated which looks like it might increase by 6% in April 2022.

The total FIT payments received so far is £16869.12 which includes the export payments as well. We have also had electricity costing approximately £4500 to use as well. The system cost £9000 so taking into account the electricity that we've saved it's been a very good investment.

Have you got a solar PV system installed? How do you find your generation in comparison? Is our production exceptional or similar? Please give your feedback in the comments below

10 Years of Solar Panels - How Much Electricity Generated & Money Made?


Wednesday, 17 November 2021

Good Inflation News for Solar! RPI Jumps in October

 The news today is all about the high levels of inflation in the UK, the core CPI rate has risen to 4.2% for October 2021 as a result of price increases for used cars, gas/electricity and petrol amongst other things. It might be bad news for consumers but if you have solar panels with the Feed in Tariff it could be good news as your FIT rate will increase by a higher amount.

The CPI rate isn't the one used for calculating the FIT prices, it's actually determined using the RPI (Retail Prices Index) which is no longer consider an official statistic any more so is a bit harder to find. However if you search the ONS website you'll see that RPI for October was a staggering  6%.

If this stays the same it means that the FIT rate will increase from 56.03p per kWh to 59.39p per kWh in April. 

If RPI increases further as is expected then we may breach the 60p FIT level. That'll help to offset the massive rise in gas and electricity prices we're paying!

Good Inflation News for Solar! RPI Jumps in October


Wednesday, 11 August 2021

2021 Solar Output Drops Compared to 2020

 The exceptional summer of 2020 hasn't been replicated in 2021 and the solar electricity generation from our panels has dropped substantially. I guess this is to be expected as it then averages out the numbers back standard.

It's quite noticeable how much lower output the 2021 months are compared to 2021 for our solar panels in Kent UK.

http://solar-panels-review.321web.co.uk/index.php/yearly-comparison-of-solar-pv

March 2020

334 kWh

March 2021

260 kWh

May 2020

517 kWh

May 2021

383 kWh

Jump forward to July and 2021 and 2020 are virtually identical at 394 vs 390 kWh.

May 2020 at 517 kWh was the highest monthly generation that we've had from our solar panels over the 10 years that we've had them installed.

2021 Solar Output Drops Compared to 2020


Tuesday, 15 June 2021

Best Months of Year for Solar Panels UK - Not Expected!

We've had our solar panels for over years now so we've collected a lot of data showing the generation over the days and months since 2011. Some interesting patterns have emerged that aren't necessarily what you would expect.

There are the more obvious extreme generation examples where you get very high and very low months depending on the weather but the month that is routinely lower than you would imagine is June.

Over the 10 year average data June is consistently lower than either May or July which is really odd as you would expect June to be the highest month for solar electricity generation as it has the longest days. Both May & July should be lower because the daylight hours are either lengthening or shrinking compared to June.

May total - 4064kWh - average 406kWh

June total - 3943 kWh - average 394 kWh

July total - 4155 kWh - average 415 kWh

So as you can see June is on average lower than May or July. This isn't just a quirk from a particularly bad June or good May or July but seems to be a genuine trend. Out of the 10 years, 5 of them have June lower than May & July and in only 3 years is June higher than both May and July.


Tuesday, 20 April 2021

British Gas FIT Payment Installation ID Problems

 I've had my solar panels for 10 years this year and over that time registered the generation meter readings every 3 months or so to get the FIT (Feed in Tariff) payments from British Gas.

I've come to do the same today and the British Gas website is refusing to accept the installation ID for my system. The number I have had since the system was fitted starts 95000 and is 12 digits long yet the BG FIT payment screen insists that the ID must begin with a 5 and be 10 digits long.


It would appear that British Gas have made some amendments to their FIT payment screens but not actually checked whether they work.

Update - on checking elsewhere it appears that BG have generated new Installation IDs but failed to actually inform any of the solar owners what the new numbers are or even to put a message on their website to let people know that it has changed.


Quite incredibly the help icon next to the error that states the installation ID must be 10 characters actually shows a 12 digit number next to it!

Very poor show British Gas! Maybe it's a deliberate ploy to stop people claiming their FIT payments!


Sunday, 8 November 2020

2020 - Worst Ever October for Solar Panels

 As an example of how nature evens out the weather in 2020 we have now had the best and worst months for solar generation since we had panels installed in 2011.

April and May 2020 beat every previous record for our system but October has now been the lowest generated for an October by a significant margin

Average for October was 205kWh with a previous minimum of 185kWh and high of 273kWh in 2018. This month was only 163kWh of electricity generated


Monday, 1 June 2020

Highest Ever Monthly Solar Generation

I've just seen on the news that May 2020 was the sunniest month on record in the UK. Having just loaded the data for our solar panels the results fully bear this out with May 2020 breaching the 500kWh generation barrier for the first time.

In May 2020 our solar panels generated a whopping 517kWh of electricity from the 3kWp set of panels. That's considerably more than the previous high of 460kWh produced in June 2018 which has the potential to be higher as the days are longer.

As we're still working from home, any additional electricity generated during the day is very welcome as we are using higher than normal amounts and can easily schedule washing machine loads at peak times.

Fortunately the days have been hot but with a cooling breeze which may have helped maximise the electricity produced.


Saturday, 2 May 2020

Sunniest April Solar Electricity Records

According to meteorological records April 2020 was one of the sunniest ever recorded https://www.bbc.co.uk/news/business-51799503
Sunniest April Solar Electricity Records

This was also reflected in our solar panel electricity generation, we got 432 kWh of electricity last month considerably up on the average of 360kWh and above our previous best of 415kWh.

http://solar-panels-review.321web.co.uk/index.php/solar-power-month-by-month/12-monthly-data/10-monthly-uk-solar-panel-electricity-output-for-april

2020 has been good so far for solar with both March & April beating previous records. It's a bonus as we're now working from home during the Coronavirus lockdown and using more electricity!

Saturday, 4 April 2020

March 2020 Record Beating Solar

March 2020 will be known for record breaking in relation to Corona Virus Covid-19 but in the UK it was also a record breaking month for solar panel electricity generation. The month seemed somewhat dull and cold but obviously there was more sun than I imagined! The cold temperatures would have also helped the panels be more efficient to improve generation too. Since mid March we have been working from home as a result of the Covid-19 virus requirements to stay inside and only travel for essential food or medicine journeys.

The total for March 2020 was 330 kWh of solar electricity produced

This compares to an 8 year average of 270 kWh with lows of 173 kWh for March 2013. You can see the full data here

http://solar-panels-review.321web.co.uk/index.php/solar-power-month-by-month/12-monthly-data/17-monthly-uk-solar-panel-electricity-output-for-march

Do you have solar panels in the UK? How did your data compare for March 2020? Post in the comments if you have any feedback on your own generation.

March 2020 Record Beating Solar

Wednesday, 15 January 2020

FIT Rates April 2020 onwards

The Feed In Tariff (FIT) rates are calculated from the base 2010 figure by applying the RPI (Retail Prices Index) rate for December to the previous rate. You can see the December rates since 2011 below.

Year

Dec RPI Rate (%)
2011
4.8
2012
3.1
2013
2.7
2014
1.6
2015
1.2
2016
2.5
2017
4.1
2018
2.7
2019
2.2

In April 2019 the rate increased to  54.17p as a result of the 2.7% increase in RPI for December 2018.

FIT Rates April 2020 onwards
With the latest RPI increase of  2.2% announced for December 2019 this rate will increase again as shown by the calculations below:

Existing Generation rate (54.17p)  x RPI (2.2%)  = New Rate (55.36p)

So the new rate for Electricity generation is 55.36p per kWh

The export rate will also increase by 2.2% from 3.82p to 3.90p


There are various other FIT rates that apply depending on the date that your solar panels were commissioned. They will also increase by 2.7% as the RPI rate for December 2019.

Monday, 18 November 2019

Solar Panels Generation Long Term Average (LTA) Electricity Output

After 8 years we've got some pretty good average generation data for our solar panels. The panels were installed on 18th November 2011 so we've now had plenty of different weather patterns over that time to see how the totals add up.

Solar Panels Generation Long Term Average (LTA) Electricity Output
Our generation meter was reading 26002 kWh this morning so that's 3250kWh per year, quite an impressive amount for 3kWp panels in the UK.

The full details are available here showing each year and month

http://solar-panels-review.321web.co.uk/index.php/yearly-comparison-of-solar-pv


Winter and Summer Solar Panel electricity generation

Saturday, 2 November 2019

PV Solar Panel Generation Deterioration Over Time?

Solar panels are expected to deteriorate over their lifetime and according to the manufacturers the generation of solar power can drop by around 0.5% per year.

What's interesting is that after 8 years this deterioration isn't visible and that the natural variation of the solar electricity generated is a far more obvious factor than the performance of the panels themselves.

http://solar-panels-review.321web.co.uk/index.php/yearly-comparison-of-solar-pv

Annual generation has varied between 2794 and 3343 kWh per year but this has not been in a straight line and generation can vary by 10% which easily masks a 0.5% variation in panels.


Friday, 1 November 2019

October 2019 - The Best and Worst Solar Generation!

The data for October 2019 is now complete and a massive contrast. The worst October power generation we've recorded since our solar panels were installed in 2011 but also the best October day since our panels were fitted.

October 2019 Solar Generation Statistics - The Best and Worst!
Although October 2019 was the lowest ever October at 186kWh electricity generated over the month as it's been quite dull and rainy, we did have a couple of very sunny days one of which gave our best October generating day ever.

October 2018 was nearly 100kWh better at 273kWh compared to the 186kWh this year.
But October 2nd 2019 generated 16.394kWh which was the highest amount for an October day that we've seen.


Full details of the electricity generation from our solar panels is below:

http://solar-panels-review.321web.co.uk/index.php/solar-power-month-by-month/12-monthly-data/20-monthly-uk-solar-panel-electricity-output-for-october